Antsle Forum
Welcome to our Antsle community! This forum is to connect all Antsle users to post experiences, make user-generated content available for the entire community and more.
Please note: This forum is about discussing one specific issue at a time. No generalizations. No judgments. Please check the Forum Rules before posting. If you have specific questions about your Antsle and expect a response from our team directly, please continue to use the appropriate channels (email: [email protected]) so every inquiry is tracked.
Antlet's Details Not Showing
Quote from rteicheira on December 5, 2019, 6:41 amSo, I thought I had a similar issue when I had my Antsle (which got stolen *grumble*), so instead of getting another one I thought I would try out the new edgeLinux on an older PC I acquired from a friend.
I have had a number of issues so far, but my current (and biggest issue) is the fact that the Antlet's details are missing (screenshot of the Nic page). The VM is running (Ubuntu 19.10 server with 1x CPU and 1GB of RAM).
The other issue I seem to be having, I seem to be having a memory leak someplace. On the dashboard, it will start out at around 10% RAM usage (8GB), and it will slowly creep up till the web interface is no longer responsive.
Any help would be greatly appreciated.
So, I thought I had a similar issue when I had my Antsle (which got stolen *grumble*), so instead of getting another one I thought I would try out the new edgeLinux on an older PC I acquired from a friend.
I have had a number of issues so far, but my current (and biggest issue) is the fact that the Antlet's details are missing (screenshot of the Nic page). The VM is running (Ubuntu 19.10 server with 1x CPU and 1GB of RAM).
The other issue I seem to be having, I seem to be having a memory leak someplace. On the dashboard, it will start out at around 10% RAM usage (8GB), and it will slowly creep up till the web interface is no longer responsive.
Any help would be greatly appreciated.
Quote from lancem on December 5, 2019, 9:35 amWhen the memory usage is high, if you ssh to your antsle and do the "top" command, what process is using the most memory (the RES column)?
When the memory usage is high, if you ssh to your antsle and do the "top" command, what process is using the most memory (the RES column)?
Quote from rteicheira on December 5, 2019, 9:46 amQuote from lancem on December 5, 2019, 9:35 amWhen the memory usage is high, if you ssh to your antsle and do the "top" command, what process is using the most memory (the RES column)?
I just looked, and it is java and qemu-system-x86.
Quote from lancem on December 5, 2019, 9:35 amWhen the memory usage is high, if you ssh to your antsle and do the "top" command, what process is using the most memory (the RES column)?
I just looked, and it is java and qemu-system-x86.
Quote from rteicheira on December 5, 2019, 10:43 amAlso interesting to note, that the Web GUI never fully loads (always has the Chrome loading circle in the tab bar). I have a feeling there are some permission issues someplace that are leading to a lot of the errors I am seeing.
Also interesting to note, that the Web GUI never fully loads (always has the Chrome loading circle in the tab bar). I have a feeling there are some permission issues someplace that are leading to a lot of the errors I am seeing.
Quote from rteicheira on December 6, 2019, 6:38 amI've let it run untouched for a day now. The Web GUI refuses to load and qemu-system-x86 is using a large number of resources.
I've let it run untouched for a day now. The Web GUI refuses to load and qemu-system-x86 is using a large number of resources.
Uploaded files: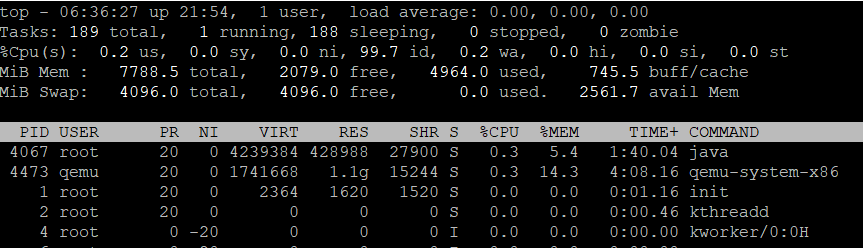
Quote from lancem on December 9, 2019, 8:57 pmWhile looking at the processes in the "top" command, if you type the "c" key, it should show the parameters of the qemu-system-x86 command.
What's the guest= parameter (this will be the name of the antlet that is using all the cpu)?
While looking at the processes in the "top" command, if you type the "c" key, it should show the parameters of the qemu-system-x86 command.
What's the guest= parameter (this will be the name of the antlet that is using all the cpu)?
Quote from rteicheira on December 10, 2019, 10:34 amSo, I ended up re-downloading and reinstalling everything, and the issues seem to have mostly resolved themselves with a clean install. It has been running a few days without all the described issues above. It still seems to be using more memory on JAVA then I would expect (so I am running around 80+% memory usage of 8GB).
For reference, when I look at top with showing the command, it references the VMs. See attached.
So, I ended up re-downloading and reinstalling everything, and the issues seem to have mostly resolved themselves with a clean install. It has been running a few days without all the described issues above. It still seems to be using more memory on JAVA then I would expect (so I am running around 80+% memory usage of 8GB).
For reference, when I look at top with showing the command, it references the VMs. See attached.
Uploaded files: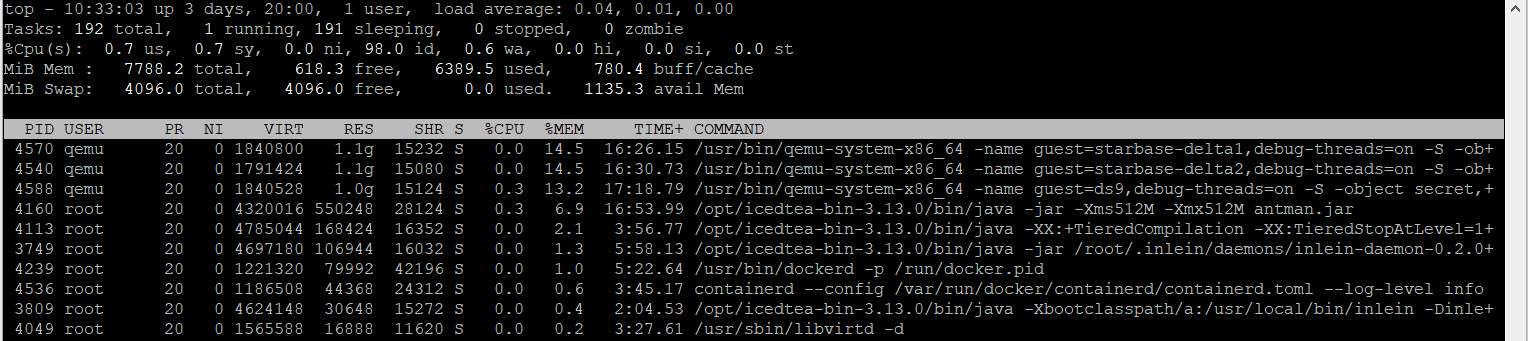
Quote from rteicheira on December 11, 2019, 7:52 amI rebooted it last night, and it started at < 50% memory usage. It keeps slowly creeping up and now at ~70%. The VMs are idle. They are running, but not doing anything.
I rebooted it last night, and it started at < 50% memory usage. It keeps slowly creeping up and now at ~70%. The VMs are idle. They are running, but not doing anything.